gnuplot hack
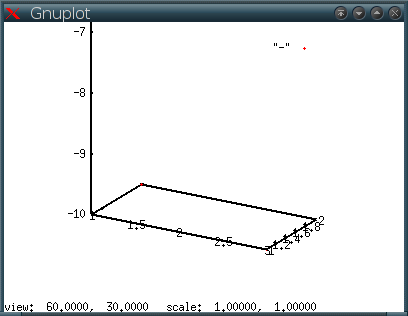
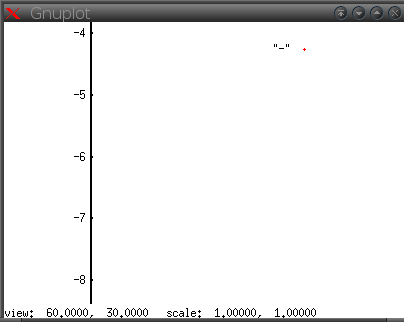
I often use gnuplot to visualize 3d scatter plots. However, I have trouble rotating the plot. The point of rotation, and zooming, always seems to be slightly above the bottom of the plot. For example given the following commands:
      set view equal xyz
      set ticslevel 0
      splot "-"
      1 2 -10
      3 1 -10
      1 2 -2
      e

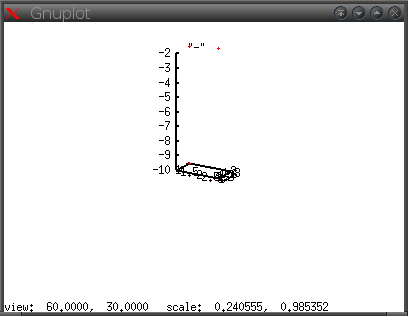
To see the complete plot we need to zoom out:

As can be seen only half of the window is being used for the plot.
After some searching in the gnuplot code I found that by adding the following line to the do_3dplot function in graph3d.c solves the problem
zcenter3d = -(ceiling_z - floor_z) / 2.0 * zscale3d + 1;
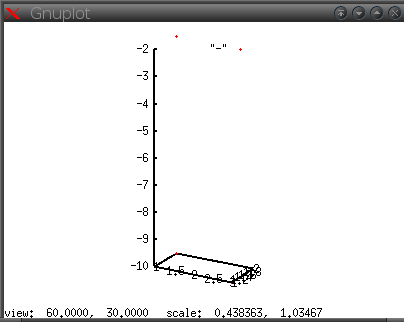
This results in the plot:

and zoomed out:
